Category graph
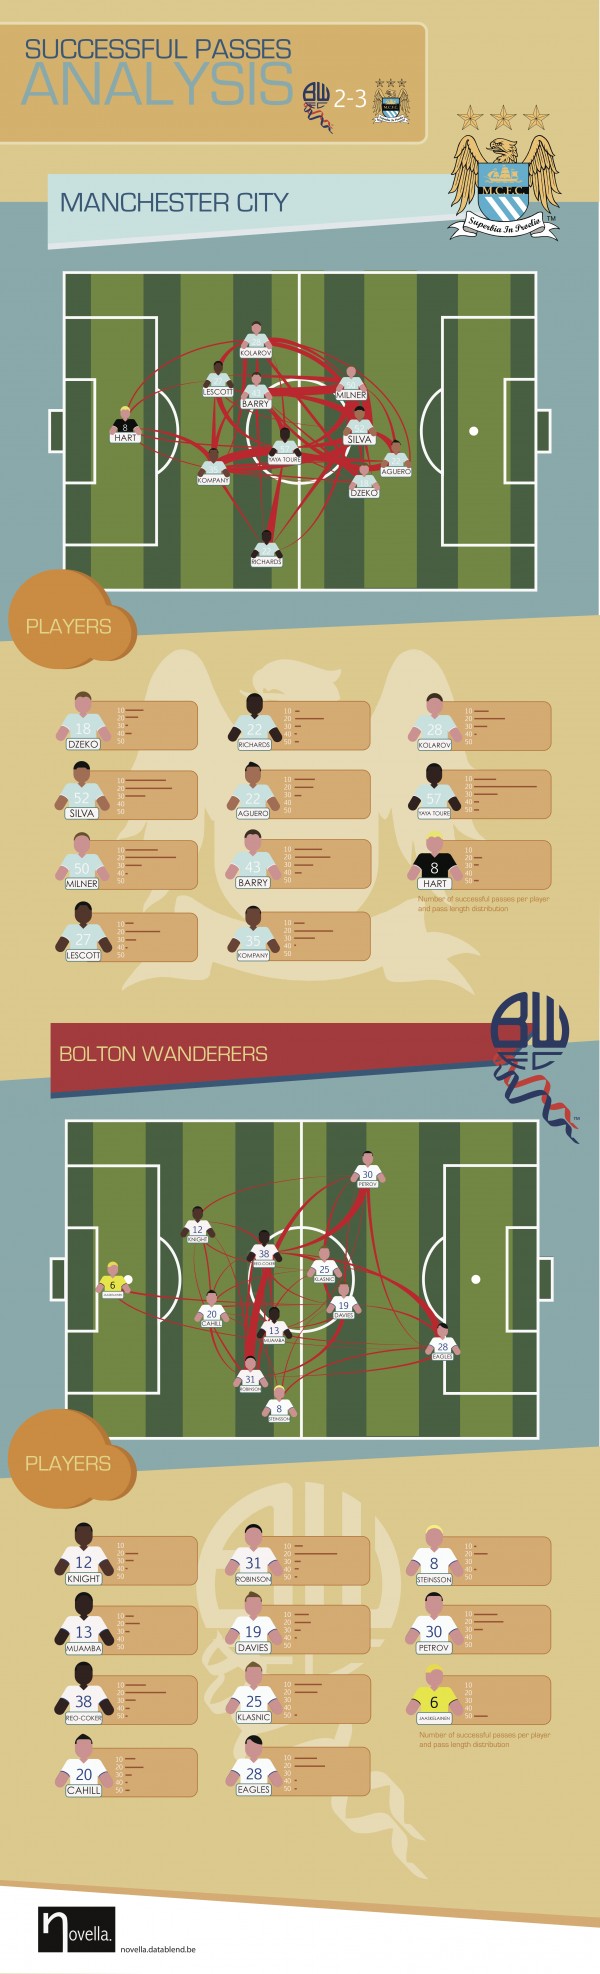
What makes Manchester City such a great team? The infographic below illustrates one of the teams most powerful characteristics: its successful passing capability. The visualisation is based upon the Opta dataset released in August 2011, containing the high detailed Bolton vs Manchester City match statistics. The data has been loaded in the neo4j graph databases
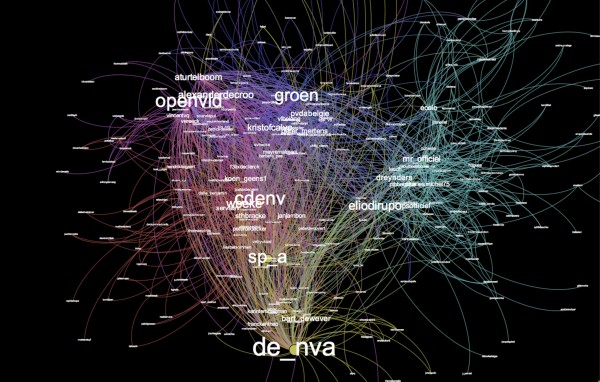
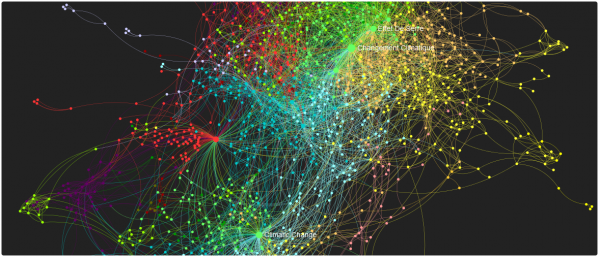
Last weekend, Engagor organised their hacktheelections hackaton. The Datablend team (Quentin, Stijn and Davy) was joined by Marc Broos, Tim Coene and Josbert van de Zande with one goal in mind: trying to visualise the (pre-arranged?) political coalition and, if possible, also predict the formation-period. Technically, we extracted over 160K tweets through the Engagor API.
Watch Davy Suvee present at GraphConnect London 2013 on the power of graph databases to analyse biological datasets. The Power of Graphs to Analyze Biological Data – Davy Suvee @ GraphConnect London 2013 from Neo Technology on Vimeo.
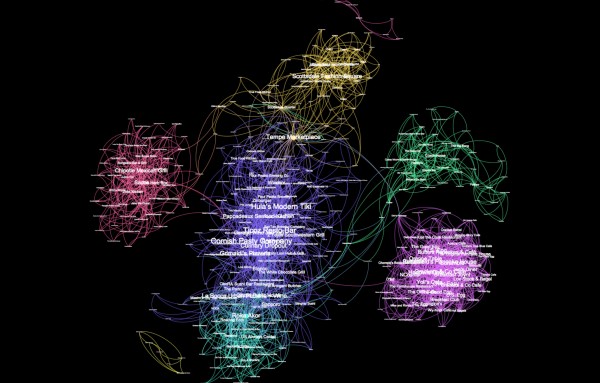
Recently, Yelp made available a sample dataset from the greater Phoenix metropolitan area including around 11.000 business, 8000 checkin-sets, 43.000 users and 230.000 user reviews. With the help of this data, data scientists can execute real-life experiments with various data mining/machine learning algorithms. In our case, we are interested in finding out whether it is possible
Yesterday evening, the 9th BigData.be MeetUp was organised at the offices of NGDATA in Ghent. With 45 people showing up, this was our best attended MeetUp till know, illustrating the growing popularity of Big Data in Belgium. The meeting had a line-up of three presentations: Kenny Helsens, who presented a wrap-up of the zimmo.be project
Last week, Datablend open-sourced two new Tinkerpop Blueprints implementations: blueprints-mongodb-graph and blueprints-datomic-graph. Tinkerpop is an open source project that provides an entire stack of technologies within the Graph Database space. At the core of this stack is the Blueprints framework. Blueprints can be considered as the JDBC of Graph Databases. By providing a collection of